In technical analysis, chart patterns often act like signposts, guiding traders toward possible price moves. Among these, the cup and handle pattern stands out as a classic bullish continuation setup. It resembles the shape of a teacup, and for decades, traders across stocks, forex, and crypto have used it to anticipate upward breakouts.
What is the Cup and Handle Pattern?
The cup and handle is a chart pattern first popularised by William J. O’Neil. It shows a period of consolidation followed by a fresh new buying pressure.
- The Cup: a U-shaped dip where the market gradually declines, stabilises, and then rises back to its previous high.
- The Handle: a smaller, downward-sloping pullback that follows the cup.
Once prices break above the handle’s resistance, it often signals strong bullish momentum.
The cup and handle formation is a step-by-step process that shows how markets pause before continuing an uptrend. It begins with a rounded decline (the cup), followed by a short pullback (the handle), and often ends with a breakout. This structure reflects both consolidation and renewed buying pressure.
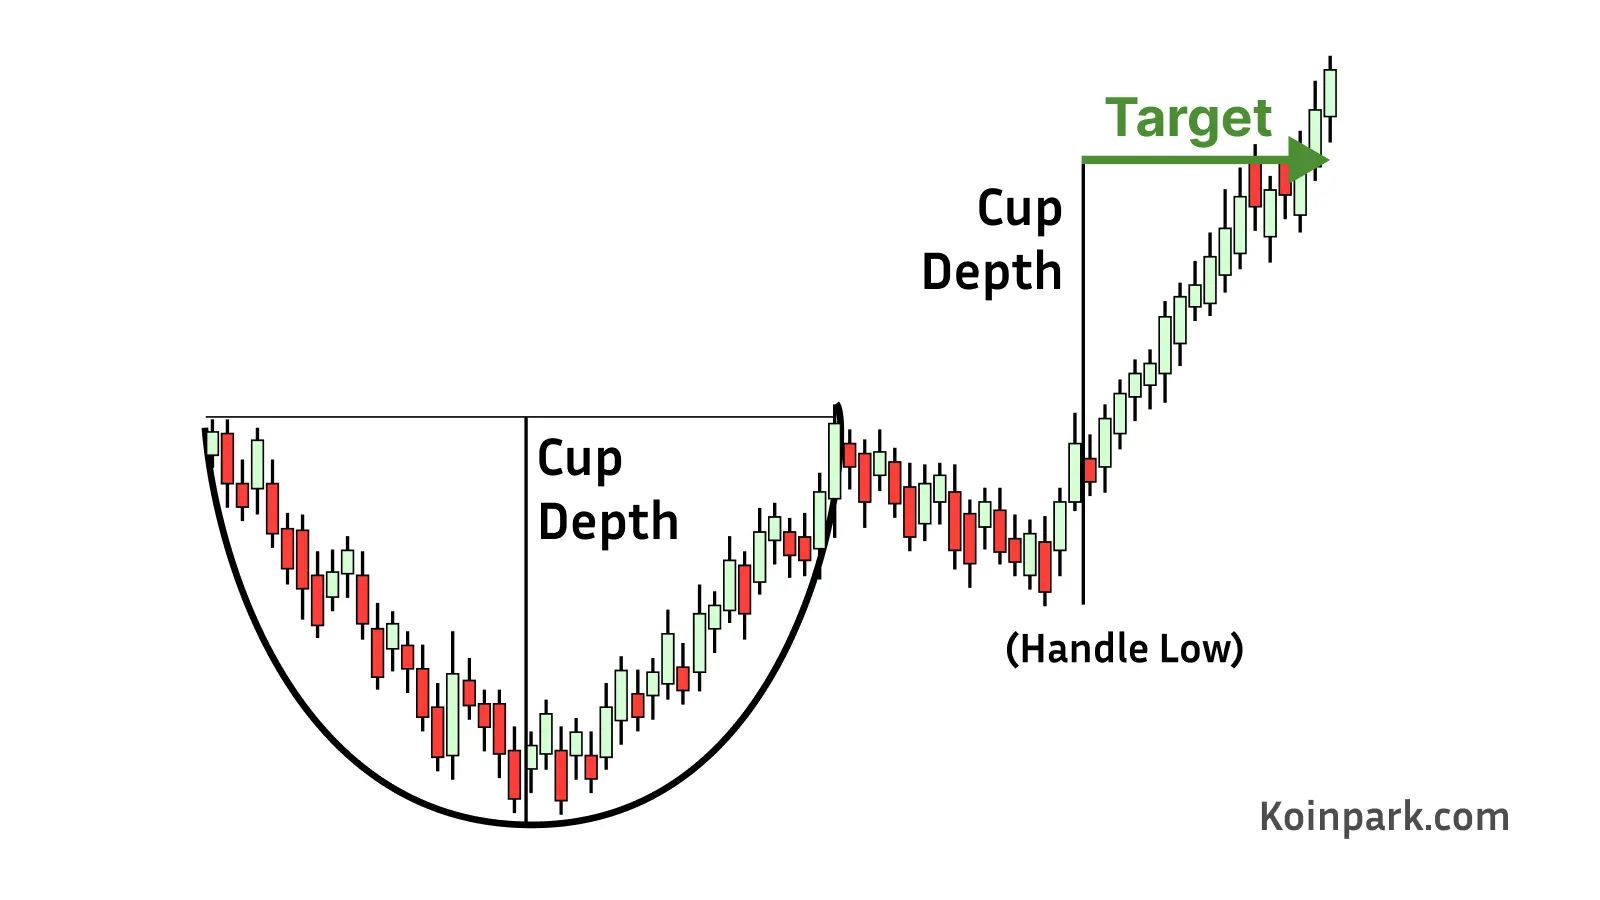
- Uptrend → The market has already been trending upward before forming the cup.
- Cup Shape → Prices dip slowly, creating a rounded bottom.
- Recovery → Prices climb back near previous highs, completing the cup.
- Handle Formation → A short, mild pullback occurs, usually slanting downward.
- Breakout → A surge in buying volume breaks resistance, pushing prices higher.
Tip: A shallow, rounded cup and a short handle often indicate a healthier pattern than deep, sharp declines.
Crypto Cup and Handle Pattern Trading Strategies
1. Identify the Crypto Cup and Handle
- Uptrend is key: Ensure the crypto has been rising, e.g., Bitcoin or altcoins trending upward.
- Cup shape: Look for a smooth U-shaped dip in price. Avoid V-shaped crashes; they indicate panic selling.
- Handle shape: Small consolidation after the cup, usually 1–3 weeks in mid-cap or large-cap coins.
Tip: Use higher timeframes (4H, daily) for stronger signals in crypto.
2. Confirm with Volume
- Volume decreases during cup formation.
- Volume increases during breakout from the handle, stronger for low-cap altcoins than Bitcoin.
- For cryptos, sudden spikes in volume can also signal whale accumulation.
3. Entry Strategies
a) Breakout Entry
- Buy when the crypto closes above the handle’s resistance.
- Example: Ethereum cup formed from $1,500 → $1,800 → $1,500, handle forms at $1,700. Buy above $1,700.
b) Pullback Entry (Safer)
- Wait for a retest of breakout level after the breakout candle.
- This avoids false breakouts, common in crypto.
c) Indicator Confirmation
- Use RSI: Ensure it’s not overbought (above 70) during entry.
- Use MACD: Look for a bullish crossover for confirmation.
4. Stop-Loss Placement
- Set your stop-loss just below the handle’s lowest level to limit potential losses.
- In crypto, due to volatility, you can set a 1–3% buffer below the handle low.
5. Target Price Calculation
- Measured Move: Cup depth + breakout price = target.
- Example: Crypto cup depth $300, breakout at $1,700 → Target = $2,000.
6. Crypto-Specific Adjustments
- Short-Term Altcoins: Handle may form in hours or days. Watch for fakeouts.
- Bitcoin Dominance: BTC’s movement can affect altcoin C&H patterns. Avoid altcoin breakouts during BTC downtrend.
- Whale Activity: Check on-chain metrics like large wallet movements—high accumulation may validate C&H breakout.
- Volatility Cushion: Keep extra buffer in stop-loss due to crypto market rapid price swings.
7. Example Crypto Trade
- Coin: Polygon (MATIC)
- Cup: $0.70 → $0.90 → $0.70
- Handle: $0.80 consolidation
- Entry: Buy at $0.82 breakout
- Stop-Loss: $0.77 (below handle low)
- Target: $0.90 + ($0.90 − $0.70) = $1.10
Read also: 12 must-know candlestick patterns
Why the Cup and Handle Matters in Trading
- Signals Strength: Shows that buyers are regaining control after consolidation.
- Reliable Breakouts: Historically considered one of the stronger bullish continuation patterns.
- Works Across Markets: Whether in stocks, forex, or crypto, the psychology behind it remains the same.
- Risk Management: The handle offers a clear stop-loss zone for traders.
- Versatility: Can be spotted on different timeframes, from daily to weekly charts.
Key Things to Watch Out For
- Volume Confirmation → Breakouts with rising volume are more trustworthy.
- Depth of Cup → Too deep a cup might signal weakness, not strength.
- False Breakouts → Always combine the pattern with indicators like moving averages.
People Also Ask
Is the cup and handle pattern bullish?
Yes, the cup and handle pattern is bullish, showing a pause in an uptrend followed by a breakout. The cup reflects consolidation, the handle a pullback, and the breakout signals renewed buying momentum.
What does a cup and handle look like?
The cup and handle pattern looks like a teacup on a chart. The cup is a rounded bottom, and the handle is a small pullback, followed by an upward breakout above resistance.
What is the success rate of the cup and handle pattern?
The cup and handle pattern has a success rate of around 65–70% in bullish conditions. Accuracy improves when the cup is shallow, the handle is short, and the breakout comes with strong trading volume.
How long does the cup and handle formation take?
The cup and handle formation usually takes weeks to months on daily charts. The cup forms slowly as prices round out, while the handle is shorter, ending with a breakout to the upside.