Bitcoin's market shows a mix of bullish momentum and consolidation as of January 4, 2025. This analysis covers key support and resistance levels, technical indicators, and moving averages to provide insight into the current market conditions, helping traders to make informed decisions in today’s fluctuating crypto market.
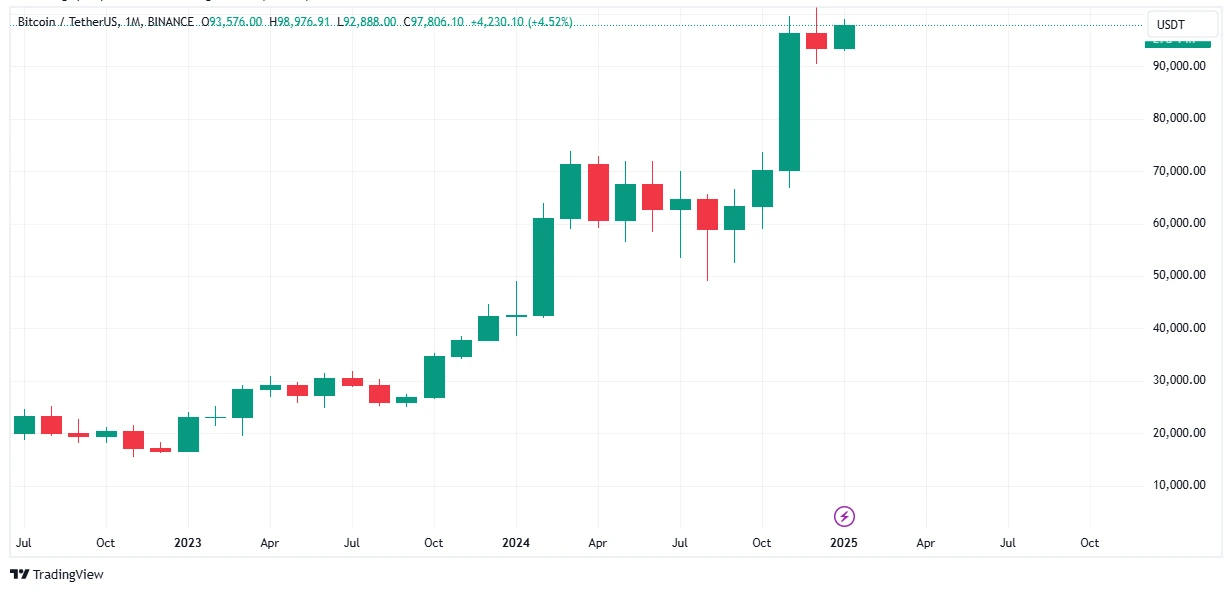
Current Price Overview
- Current Price: $97,869.95
- 24h High: $98,956.92
- 24h Low: $96,034.61
- Yesterday's Opening Price: $96,881.73
- Yesterday's Closing Price: $98,107.43
Market Trends
- Price Change: The price has increased by 1.27% compared to yesterday’s close.
- 24h Trading Volume: $34.71B, down by 15.01% from the previous day.
- Market Cap: $1.94T
- 7-day Change: +3.51%
- 1-month Change: +0.72%
- 1-year Change: +121.19%
- YTD Change: +4.40%
Technical Indicators
- RSI (14): 52.26 (Neutral)—no significant overbought or oversold conditions.
- Stochastic Oscillator (STOCH): 99.53 (Overbought)—indicates possible short-term resistance.
- MACD (12, 26): 203.6 (Buy)—bullish momentum in play.
- ADX (14): 21.08 (Sell)—weak trend strength, indicating indecision in the market.
- Williams %R: -1.03 (Overbought)—suggests potential short-term resistance.
- CCI (14): -167.61 (Sell)—momentum is bearish, showing possible downside risk.
- Ultimate Oscillator: 42.51 (Sell)—signals potential weakness in momentum.
- ATR (14): 284.39—indicating lower volatility compared to previous periods.
Moving Averages
1. Short-Term Moving Averages (5, 10, 20): Bearish—strong sell signals across the short-term averages.
- MA5: $98,048.3
- MA10: $98,069.5
- MA20: $98,065.8
2. Long-Term Moving Averages (50, 100, 200): Bullish—showing strong support levels in the medium to long-term.
- MA50: $97,292.4
- MA100: $95,779.1
- MA200: $95,088.8
Support and Resistance Levels
Support Levels:
- S1: $97,775.5
- S2: $97,648.2
- S3: $97,394.2
Resistance Levels:
- R1: $98,156.9
- R2: $98,411.0
- R3: $98,538.3
Pivot Points (Classic Method)
1. Pivot Point: $98,029.6
2. Support:
- S1: $97,775.5
- S2: $97,648.2
- S3: $97,394.2
3. Resistance:
- R1: $98,156.9
- R2: $98,411.0
- R3: $98,538.3
Key Observations
- Market Sentiment: The market is in a neutral to slightly bullish state, with strong buying signals from long-term moving averages and the MACD. However, the Stochastic and Williams %R indicators suggest overbought conditions, which could lead to short-term resistance.
- Immediate Support: The nearest support level is at $97,775.5 (S1). A break below this level could lead to a further dip towards $97,394.2 (S3).
- Immediate Resistance: Bitcoin is currently facing resistance near $98,156.9 (R1), with potential for further gains if the price breaks this level. However, the overbought conditions indicate caution for any significant upward move without a pullback.
Outlook and Forecast
- Bullish Scenario: If Bitcoin breaks above the $98,411.0 (R2) resistance level, further upward movement could be expected towards $98,538.3 (R3).
- Bearish Scenario: If Bitcoin falls below $97,775.5 (S1), we may see a deeper correction towards $97,394.2 (S3), with potential support around the MA50 at $97,292.4.
Conclusion
Bitcoin is currently experiencing a period of consolidation. While there is short-term resistance at $98,156.9 and overbought conditions, the strong long-term support levels and positive MACD suggest that the overall bullish trend remains intact. Traders should monitor key support and resistance levels for potential breakouts or reversals.